GLOBE
Global Building Emissions (GLOBE) Database
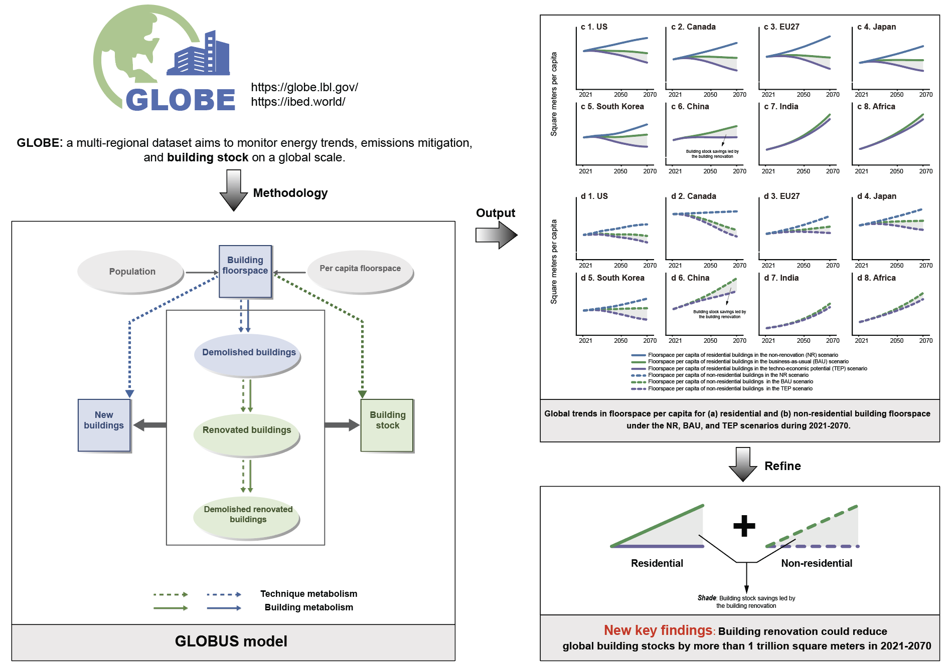
A multi-regional dataset aims to monitor energy trends, emissions mitigation, and building stock on a global scale.
GLOBE was initially proposed by Dr. Minda Ma in 2021, and now it is a project led by Lawrence Berkeley National Laboratory![]() (LBNL, operated by UC Berkeley for U.S. DOE), Tsinghua University
(LBNL, operated by UC Berkeley for U.S. DOE), Tsinghua University![]() , and Chongqing University
, and Chongqing University![]() .
.

Global Building Emissions (GLOBE) Database (http://globe2060.org and https://globe.lbl.gov, also known as the second generation of IBED: https://ibed.world)
About GLOBE
We are pleased to announce the release of a public version of our dataset, which is accessible at http://ibed.world. Our dataset is established based on the IEA database, which has clear distinctions between the end uses relevant to residential and commercial energy activities in its energy balance sheet.
To ensure the reliability of our database, we used the IEA dataset as the primary reference to compile comprehensive and trustworthy data tables for each carbon-emitting country. For major emitters such as China, the United States, and India, we accounted for and calibrated the building energy consumption data and the corresponding carbon emissions data based on the baseline dataset. For other carbon-emitting countries, we collected, cleaned, and validated survey reports and statistical results from regional governments and research institutions, which were then integrated with the baseline dataset to build a unified and standardized database.

Publications of GLOBE
In 2023, some of GLOBE's noteworthy applications have been featured in international journals like Advances in Applied Energy, Applied Energy, and Sustainable Cities and Society. [1] Xiang X, Zhou N, Ma M*, Feng W, Yan R. Global transition of operational carbon in residential buildings since the millennium. Advances in Applied Energy 2023;11:100145. [2] Yan R, Ma M*, Zhou N, Feng W, Xiang X, Mao C. Towards COP27: Decarbonization patterns of residential building in China and India. Applied Energy 2023;352:122003. [3] Yan R, Chen M, Xiang X, Feng W, Ma M*. Heterogeneity or illusion? Track the carbon Kuznets curve of global residential building operations. Applied Energy 2023;347:121441. [4] Zhang S, Zhou N, Feng W, Ma M*, Xiang X, You K. Pathway for decarbonizing residential building operations in the US and China beyond the mid-century. Applied Energy 2023;342:121164. [5] Chen L, Ma M*, Xiang X. Decarbonizing or illusion? How carbon emissions of commercial building operations change worldwide. Sustainable Cities and Society 2023;96:104654. [6] Xiang X, Ma M*, Ma X, Chen L, Cai W, Feng W, et al. Historical decarbonization of global commercial building operations in the 21st century. Applied Energy 2022;322:119401. [7] Zhang S, Ma M*, Xiang X, Cai W, Feng W, Ma Z. Potential to decarbonize the commercial building operation of the top two emitters by 2060. Resources, Conservation and Recycling 2022;185:106481.
Carbon emissions of residential building operations
| Regions | Name | Abbreviations | Unit | 2000 | 2010 | 2020 |
|---|---|---|---|---|---|---|
| Europe & New Zealand | Carbon emissions | $C$ | $\text{MtCO}_2$ | 1089.5 | 1086.1 | 802.2 |
| Europe & New Zealand | Share of residential space heating | $C_{RSH}$ | $\%$ | 50.3% | 50.8% | 49.8% |
| Europe & New Zealand | Share of residential space cooling | $C_{RSC}$ | $\%$ | 2.3% | 2.1% | 2.3% |
| Europe & New Zealand | Share of other end uses | $C_{RA}$ | $\%$ | 47.4% | 47.1% | 47.9% |
| South America (Brazil, Colombia, Argentina, Chile, Uruguay) | Carbon emissions | $C$ | $\text{MtCO}_2$ | 63.2 | 82.5 | 102.4 |
| South America (Brazil, Colombia, Argentina, Chile, Uruguay) | Share of residential space heating | $C_{RSH}$ | $\%$ | 17.2% | 18.3% | 17.8% |
| South America (Brazil, Colombia, Argentina, Chile, Uruguay) | Share of residential space cooling | $C_{RSC}$ | $\%$ | 3.2% | 6.7% | 9.8% |
| South America (Brazil, Colombia, Argentina, Chile, Uruguay) | Share of other end uses | $C_{RA}$ | $\%$ | 79.6% | 75.0% | 72.4% |
| China | Carbon emissions | $C$ | $\text{MtCO}_2$ | 412.9 | 690.7 | 803.4 |
| China | Share of residential space heating | $C_{RSH}$ | $\%$ | 43.0% | 43.4% | 36.1% |
| China | Share of residential space cooling | $C_{RSC}$ | $\%$ | 6.2% | 6.1% | 11.3% |
| China | Share of other end uses | $C_{RA}$ | $\%$ | 50.9% | 50.5% | 52.5% |
| India | Carbon emissions | $C$ | $\text{MtCO}_2$ | 157.5 | 248.2 | 375 |
| India | Share of residential space heating | $C_{RSH}$ | $\%$ | 0.0% | 0.0% | 0.0% |
| India | Share of residential space cooling | $C_{RSC}$ | $\%$ | 22.5% | 29.7% | 36.4% |
| India | Share of other end uses | $C_{RA}$ | $\%$ | 77.5% | 70.3% | 63.6% |
| Northeast Asia (Japan, Korea) | Carbon emissions | $C$ | $\text{MtCO}_2$ | 239.9 | 285.5 | 281.6 |
| Northeast Asia (Japan, Korea) | Share of residential space heating | $C_{RSH}$ | $\%$ | 29.2% | 29.6% | 26.7% |
| Northeast Asia (Japan, Korea) | Share of residential space cooling | $C_{RSC}$ | $\%$ | 3.4% | 4.0% | 3.2% |
| Northeast Asia (Japan, Korea) | Share of other end uses | $C_{RA}$ | $\%$ | 67.4% | 66.4% | 70.0% |
| Africa (South Africa, Morocco) | Carbon emissions | $C$ | $\text{MtCO}_2$ | 41 | 66.1 | 88.2 |
| Africa (South Africa, Morocco) | Share of residential space heating | $C_{RSH}$ | $\%$ | 14.4% | 14.2% | 13.8% |
| Africa (South Africa, Morocco) | Share of residential space cooling | $C_{RSC}$ | $\%$ | 14.3% | 14.2% | 13.7% |
| Africa (South Africa, Morocco) | Share of other end uses | $C_{RA}$ | $\%$ | 71.3% | 71.7% | 72.5% |
| North America | Carbon emissions | $C$ | $\text{MtCO}_2$ | 1289 | 1267.8 | 969.2 |
| North America | Share of residential space heating | $C_{RSH}$ | $\%$ | 37.9% | 31.0% | 36.1% |
| North America | Share of residential space cooling | $C_{RSC}$ | $\%$ | 7.9% | 10.4% | 9.6% |
| North America | Share of other end uses | $C_{RA}$ | $\%$ | 54.3% | 58.6% | 54.3% |
| Australia | Carbon emissions | $C$ | $\text{MtCO}_2$ | 54.9 | 67.8 | 54.8 |
| Australia | Share of residential space heating | $C_{RSH}$ | $\%$ | 14.5% | 14.8% | 17.3% |
| Australia | Share of residential space cooling | $C_{RSC}$ | $\%$ | 5.2% | 7.3% | 8.2% |
| Australia | Share of other end uses | $C_{RA}$ | $\%$ | 80.3% | 77.9% | 74.6% |
Energy consumption of residential building operations
| Regions | Name | Abbreviations | Unit | 2000 | 2010 | 2020 |
|---|---|---|---|---|---|---|
| Europe & New Zealand | Energy consumption | $E$ | Peta joule $(\text{PJ})$ | 15047.47 | 16564.21 | 14579.32 |
| Europe & New Zealand | Share of residential space heating | $E_{RSH}$ | $\%$ | 62.3% | 61.6% | 57.2% |
| Europe & New Zealand | Share of residential space cooling | $E_{RSC}$ | $\%$ | 1.9% | 1.9% | 2.0% |
| Europe & New Zealand | Share of other end uses | $E_{RA}$ | $\%$ | 35.8% | 36.4% | 40.8% |
| South America (Brazil, Colombia, Argentina, Chile, Uruguay) | Energy consumption | $E$ | Peta joule $(\text{PJ})$ | 1668.4 | 2001.8 | 2326.2 |
| South America (Brazil, Colombia, Argentina, Chile, Uruguay) | Share of residential space heating | $E_{RSH}$ | $\%$ | 13.4% | 14.7% | 14.9% |
| South America (Brazil, Colombia, Argentina, Chile, Uruguay) | Share of residential space cooling | $E_{RSC}$ | $\%$ | 5.5% | 7.5% | 9.7% |
| South America (Brazil, Colombia, Argentina, Chile, Uruguay) | Share of other end uses | $E_{RA}$ | $\%$ | 81.2% | 77.9% | 75.3% |
| China | Energy consumption | $E$ | Peta joule $(\text{PJ})$ | 5157.2 | 11614.6 | 19192.9 |
| China | Share of residential space heating | $E_{RSH}$ | $\%$ | 50.4% | 50.4% | 44.3% |
| China | Share of residential space cooling | $E_{RSC}$ | $\%$ | 4.8% | 4.8% | 9.9% |
| China | Share of other end uses | $E_{RA}$ | $\%$ | 44.8% | 44.8% | 45.8% |
| India | Energy consumption | $E$ | Peta joule $(\text{PJ})$ | 1142.2 | 1672.9 | 2598 |
| India | Share of residential space heating | $E_{RSH}$ | $\%$ | 0.0% | 0.0% | 0.0% |
| India | Share of residential space cooling | $E_{RSC}$ | $\%$ | 9.0% | 14.6% | 22.0% |
| India | Share of other end uses | $E_{RA}$ | $\%$ | 91.0% | 85.4% | 78.0% |
| Northeast Asia (Japan, Korea) | Energy consumption | $E$ | Peta joule $(\text{PJ})$ | 2766.1 | 2982.9 | 2829.8 |
| Northeast Asia (Japan, Korea) | Share of residential space heating | $E_{RSH}$ | $\%$ | 34.8% | 35.9% | 33.6% |
| Northeast Asia (Japan, Korea) | Share of residential space cooling | $E_{RSC}$ | $\%$ | 2.3% | 2.7% | 2.2% |
| Northeast Asia (Japan, Korea) | Share of other end uses | $E_{RA}$ | $\%$ | 62.9% | 61.3% | 64.2% |
| Africa (South Africa, Morocco) | Energy consumption | $E$ | Peta joule $(\text{PJ})$ | 569.5 | 574.2 | 681.7 |
| Africa (South Africa, Morocco) | Share of residential space heating | $E_{RSH}$ | $\%$ | 14.8% | 13.6% | 12.8% |
| Africa (South Africa, Morocco) | Share of residential space cooling | $E_{RSC}$ | $\%$ | 13.1% | 12.7% | 12.5% |
| Africa (South Africa, Morocco) | Share of other end uses | $E_{RA}$ | $\%$ | 72.1% | 73.8% | 74.6% |
| North America | Energy consumption | $E$ | Peta joule $(\text{PJ})$ | 12250.9 | 12894.7 | 12941.2 |
| North America | Share of residential space heating | $E_{RSH}$ | $\%$ | 56.4% | 48.8% | 46.9% |
| North America | Share of residential space cooling | $E_{RSC}$ | $\%$ | 4.3% | 6.3% | 7.3% |
| North America | Share of other end uses | $E_{RA}$ | $\%$ | 39.3% | 44.8% | 45.8% |
| Australia | Energy consumption | $E$ | Peta joule $(\text{PJ})$ | 378.4 | 428.8 | 455.2 |
| Australia | Share of residential space heating | $E_{RSH}$ | $\%$ | 44.2% | 37.2% | 35.7% |
| Australia | Share of residential space cooling | $E_{RSC}$ | $\%$ | 2.7% | 4.2% | 4.7% |
| Australia | Share of other end uses | $E_{RA}$ | $\%$ | 53.1% | 58.5% | 59.5% |
Socio-economic indicators of residential buildings
| Regions | Name | Abbreviations | Unit | 2000 | 2010 | 2020 |
|---|---|---|---|---|---|---|
| Europe & New Zealand | Population size | $P$ | Million persons | 659.3 | 682.5 | 704.8 |
| Europe & New Zealand | Average household size | $p$ | persons per household | 2.7 | 2.6 | 2.4 |
| South America (Brazil, Colombia, Argentina, Chile, Uruguay) | Population size | $P$ | Million persons | 270 | 302.1 | 331.4 |
| South America (Brazil, Colombia, Argentina, Chile, Uruguay) | Average household size | $p$ | persons per household | 4.5 | 4 | 3.6 |
| China | Population size | $P$ | Million persons | 1262.6 | 1337.7 | 1411.1 |
| China | Average household size | $p$ | persons per household | 3.4 | 3.1 | 2.6 |
| India | Population size | $P$ | Million persons | 1012.6 | 1180.9 | 1347.1 |
| India | Average household size | $p$ | persons per household | 5.4 | 5.1 | 4.8 |
| Northeast Asia (Japan, Korea) | Population size | $P$ | Million persons | 173.9 | 177.6 | 178.1 |
| Northeast Asia (Japan, Korea) | Average household size | $p$ | persons per household | 2.8 | 2.6 | 2.4 |
| Africa (South Africa, Morocco) | Population size | $P$ | Million persons | 73.8 | 83.6 | 96.2 |
| Africa (South Africa, Morocco) | Average household size | $p$ | persons per household | 6.1 | 5.5 | 5.7 |
| North America | Population size | $P$ | Million persons | 312.9 | 343.3 | 368.2 |
| North America | Average household size | $p$ | persons per household | 2.6 | 2.6 | 2.5 |
| Australia | Population size | $P$ | Million persons | 19.2 | 22 | 25.7 |
| Australia | Average household size | $p$ | persons per household | 2.6 | 2.6 | 2.5 |
Data availability
For additional information, including detailed energy activities of residential buildings' end uses, commercial building stocks, and energy and emissions of commercial buildings' end uses, you can contact the project leader, Dr. Minda Ma, at maminda@lbl.gov. We will provide the requested information upon reasonable request.
ArchTracking
ArchTracking is an upcoming software program for tracking the nation-regional energy and emission impacts of building decarbonization measures.
PyLMDI
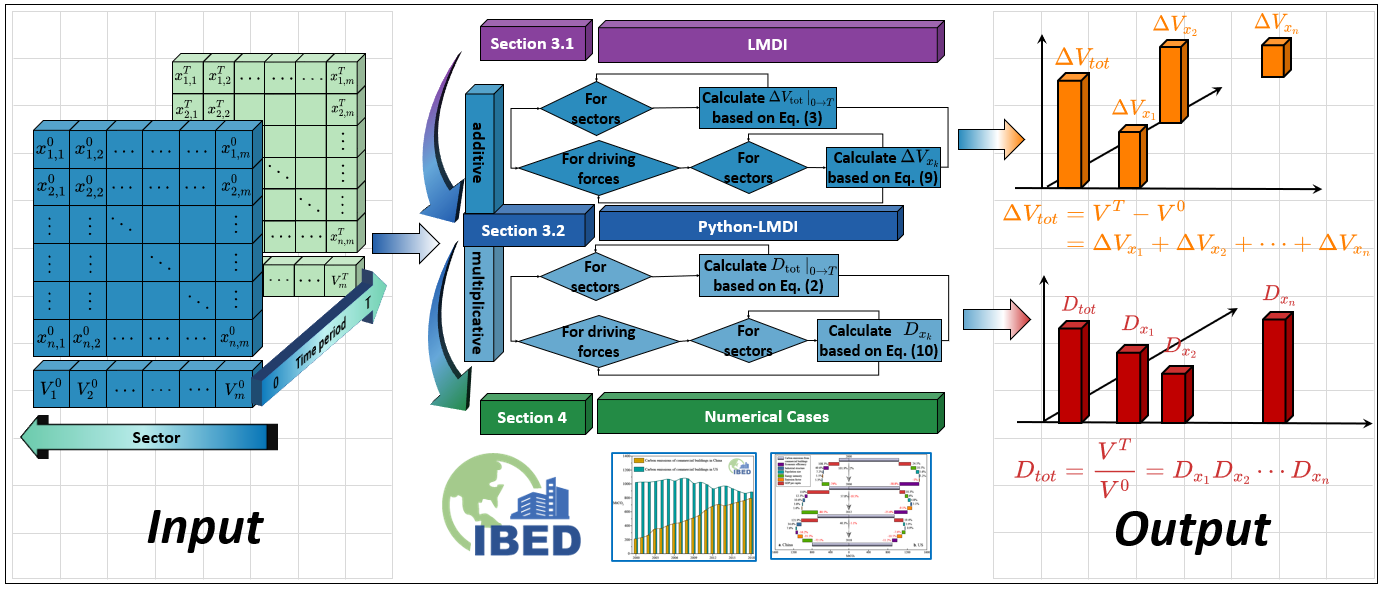
Python-LMDI: a tool for index decomposition analysis of building carbon emissions
A timely analysis for carbon emission reduction in buildings is an effective global response to the crisis of climate change. The logarithmic mean Divisia index (LMDI) decomposition analysis approach has been extensively used to assess the carbon emission reduction potential of the buildings sector. In order to simplify the calculation process and to expand its application scope, a new open-source Python tool (PyLMDI) developed in this article is used to compute the results of LMDI decomposition analysis, including multiplicative and additive decomposition. Users can quickly obtain the decomposition result by initializing the input data through a simple class data structure. In addition, the carbon emissions from commercial buildings are used as a numerical example to demonstrate the function of PyLMDI. In summary, PyLMDI is a potential calculation tool for index decomposition analysis that can provide calculation guidance for carbon emission reduction in the buildings sector. The data and codes for the numerical example are also included.
Source codes
import numpy as npfrom operation import Lfun
class PyLMDI():    def __init__(self,Vt,V0,Xt,X0):        self.V0 = V0        self.Vt = Vt        self.X0 = X0        self.Xt = Xt            def Add(self):        Delta_V = [sum(self.Vt)-np.sum(self.V0)]        for start, end in zip(self.X0, self.Xt):            temp = sum([ Lfun(self.Vt[i], self.V0[i]) * np.log(end[i]/start[i])                         for i in range(len(start))])            Delta_V.append(temp)               return Delta_V
    def Mul(self):        D_V = [sum(self.Vt) / np.sum(self.V0)]        for start, end in zip(self.X0,self.Xt):            temp = sum([Lfun(self.Vt[i], self.V0[i])/Lfun(sum(self.Vt),sum(self.V0))*np.log(end[i]/start[i])                        for i in range(len(start))])            D_V.append(np.exp(temp))                    return
GLOBUS
In 2024, we create a global building stock model (GLOBUS) incorporating turnover and renovations.
GLOBUS’s primary contribution lies in providing a dataset of global building stock turnover using scenarios that incorporate various levels of building renovation.
By unifying the evaluation indicators, the dataset empowers building science researchers to perform comparative analyses based on floorspace.